Cattle vs. deer in satellite imagery: reading mixed-use range right
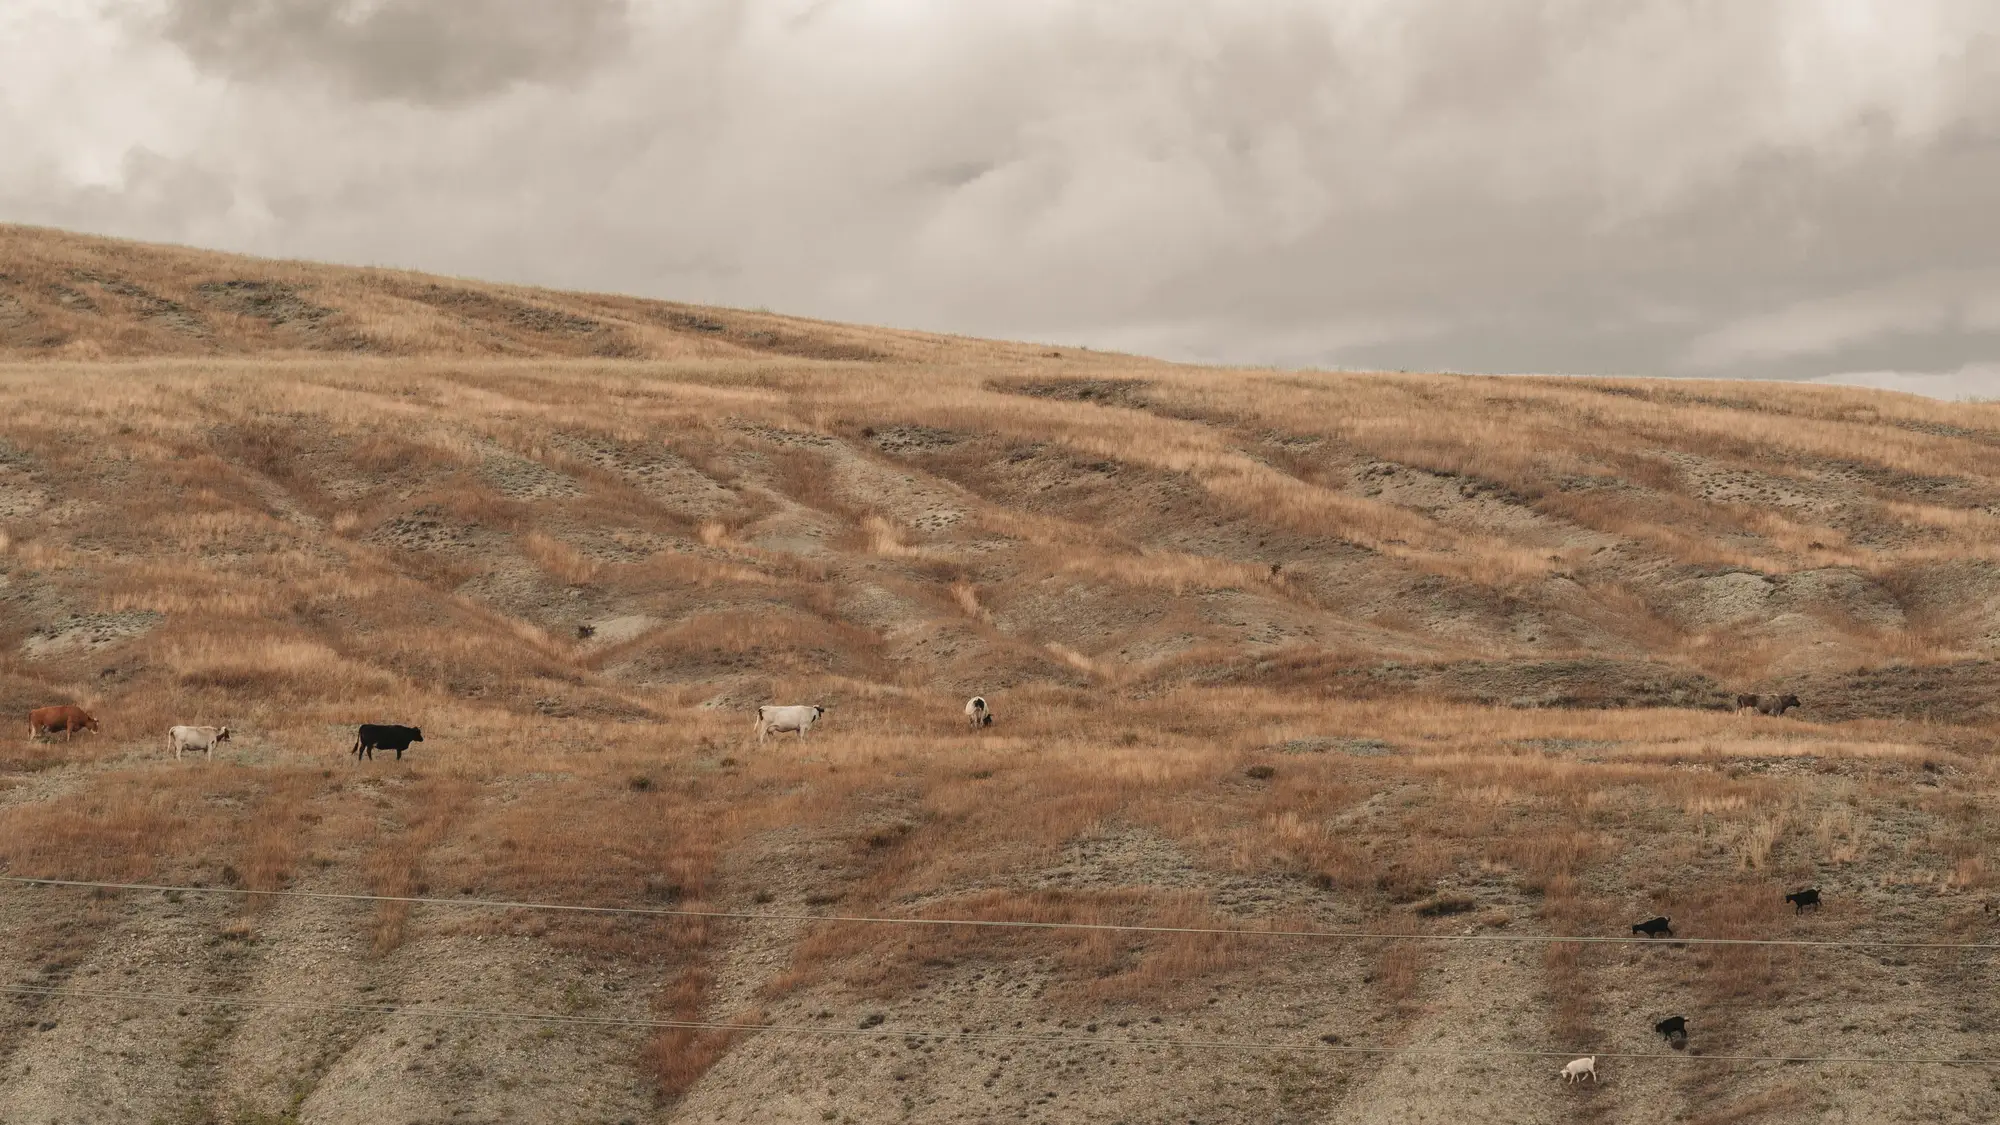
If your allotment runs cattle alongside mule deer, elk, or pronghorn, any count pulled from satellite imagery has to answer one question before it answers anything else: is that a cow or a deer standing in the sagebrush. Get that wrong at scale and your stocking rate math is wrong too, because you're grazing pressure against animals that aren't yours to manage.
What separates the two on a VHR frame, and where the read still gets messy:
Size and shape at sub-meter resolution
A mature cow carries roughly double the body mass of a mule deer, and at 0.3 m GSD or finer, that shows up as a plain size difference on screen: a blockier, wider-bodied shape versus a leaner, longer-legged one. Elk complicate this, since a cow elk can approach a small beef animal in bulk and cast a similar footprint from directly overhead. Pronghorn are the easy case, small-bodied and usually moving in tight bunches that don't resemble cattle spacing at all.
Shape alone gets you most of the way on a clean, well-lit frame. It doesn't get you all the way, especially with elk mixed into the same pasture.
Herd pattern tells you more than any single animal
This is where mixed-use range gives up real information. Cattle hold near water, salt, and mineral stations, and they graze in loose, circular bunches that drift along fence lines, because fence lines are the edge of their world. Wild ungulates don't respect that geometry. Deer bed in draws and brush lines and move in small family groups that stay close to cover. Elk herd tighter and range farther from water than cattle typically will on a hot afternoon. Pronghorn stay out in the open but in groups that don't cluster around infrastructure the way cattle do.
So the habit of the animal on the ground, not just its silhouette, is often the tell. A cluster sitting fifty yards off a stock tank reads as cattle before you even measure the shape. A line of animals strung along a brush draw reads as deer whether or not you can resolve antlers.
Timing the capture matters as much as the resolution
Cattle on open range are out grazing through most of the daylight hours, which is exactly when a satellite pass happens. Deer and elk are more active at dawn and dusk and tend to be bedded in timber or brush shadow by midday, which means a midday frame can simply show fewer wild animals than are on the pasture, not because they're absent but because they're tucked out of view. That's good news for a cattle count. It means a well-timed monthly pass is already biased toward catching your cattle and missing a chunk of the wildlife that would otherwise muddy the tally.
Why the distinction matters for your stocking rate
None of this is academic if you're trying to match head count to forage. A pasture that looks overstocked because the frame caught forty cows and an elk herd bedded near the same creek bottom isn't actually overstocked. It's two species sharing one patch of range, and only one of them answers to your stocking rate. Getting the count right animal by animal is what makes the stocking-rate flag worth trusting instead of a reason to second-guess every pasture report.
That species-level read is exactly what sits behind the monthly per-pasture head count and stocking-rate flag that Livestock Counting builds from each pass. If you're running cattle on range where deer, elk, or pronghorn share the same ground, it's worth seeing what a monthly count looks like for your own pastures.