Know how many head are in each pasture before the grass runs short.
Livestock Counting counts the animals in every pasture you send us and reads the standing forage, once a month, then flags the pastures that look over- or under-stocked.
- GSD
- ≤0.3 m (VHR)
- Cadence
- Monthly
- Platform
- VHR satellite / aerial
- Spectral
- RGB
How stocking gets checked now
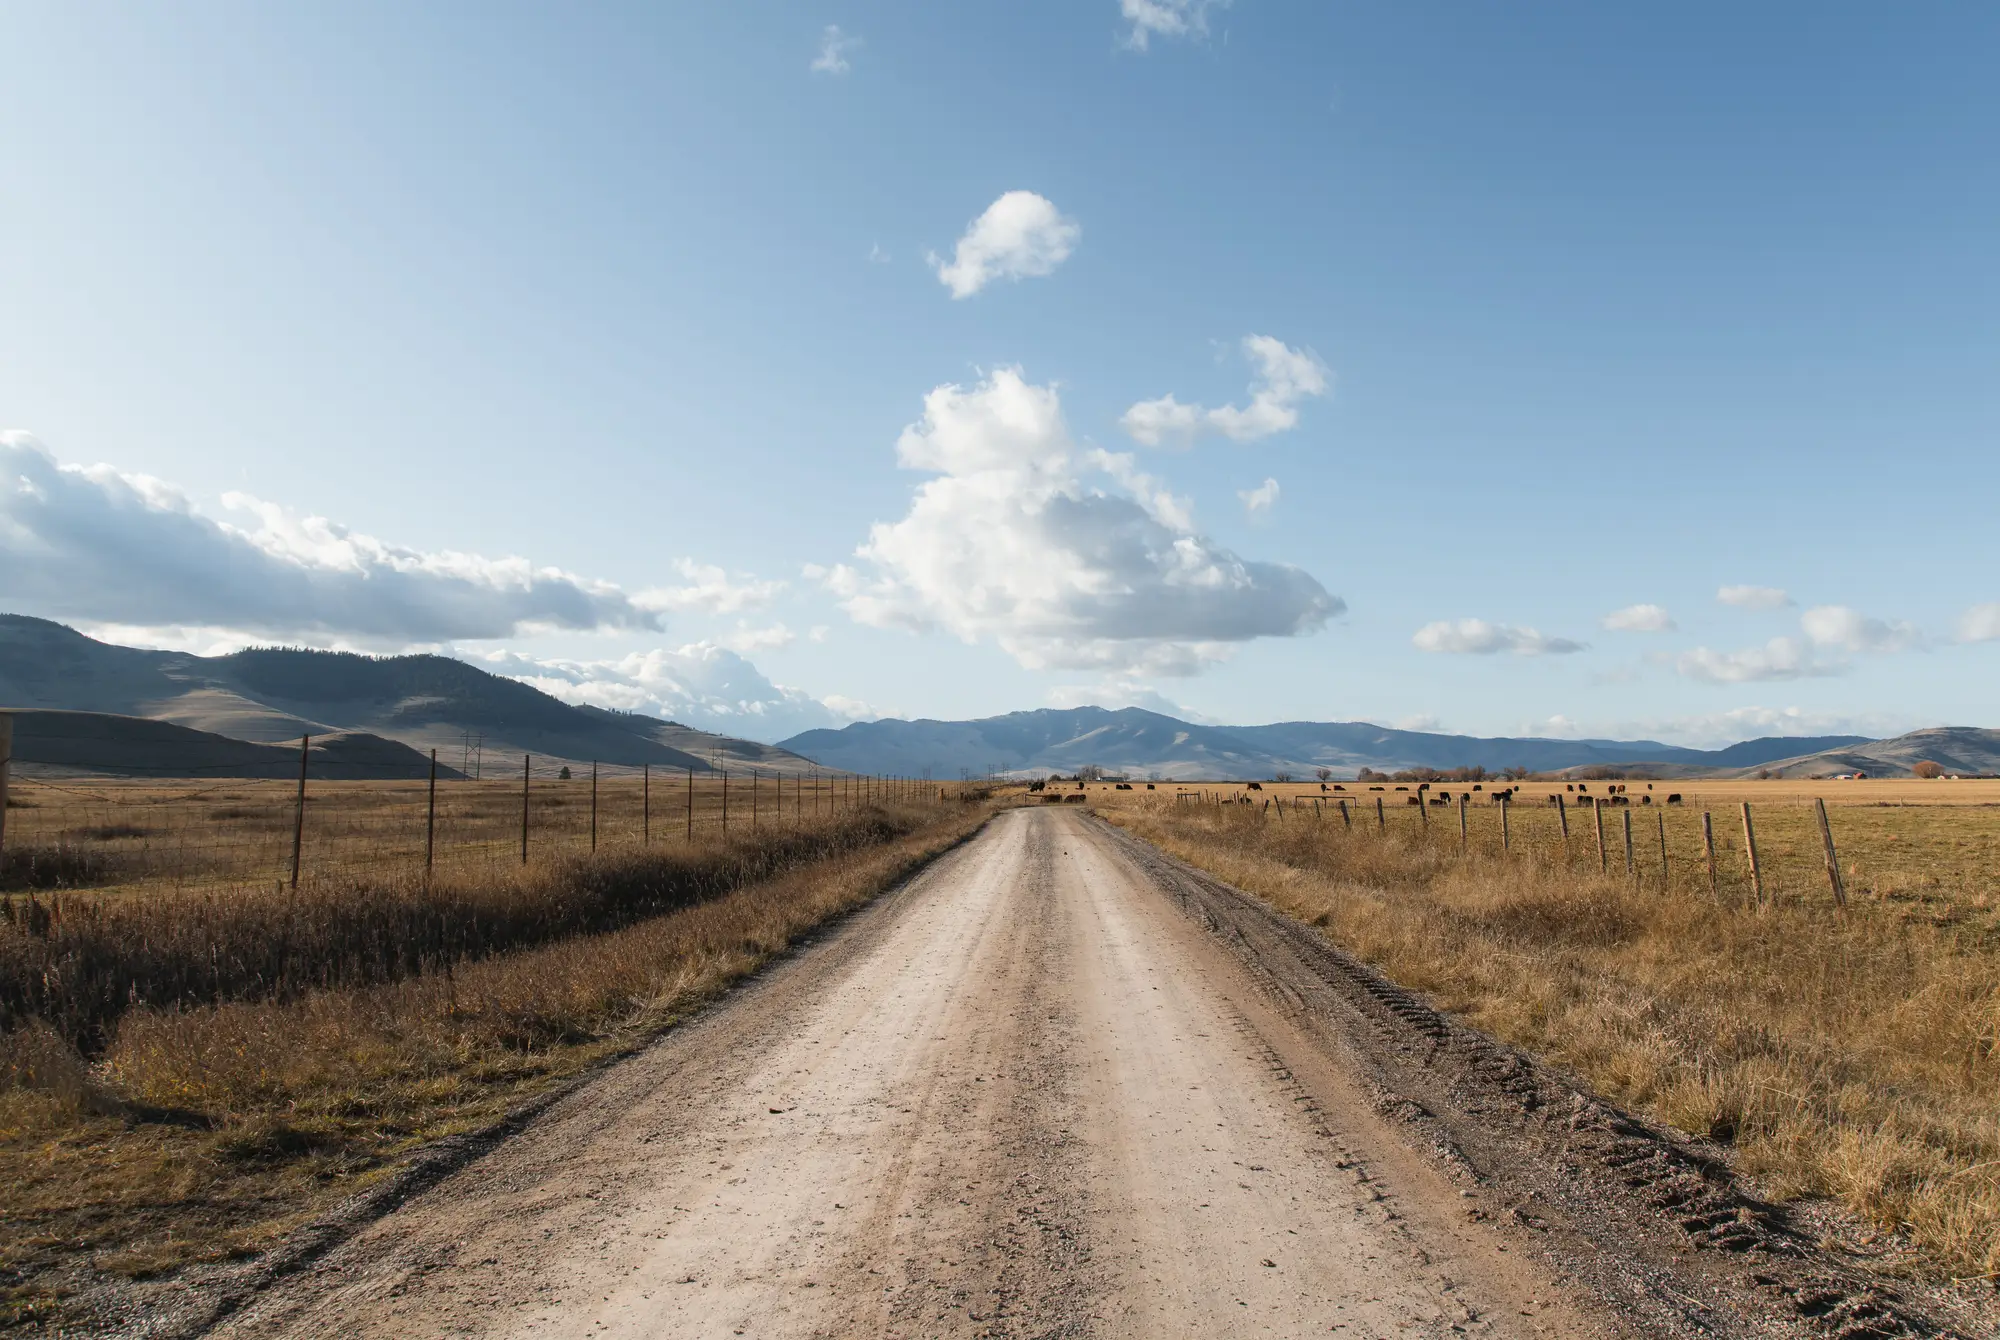
You turned the herd out with a number in your head and a number in the book. After that, the count is whatever you see from the pickup. A pasture rider rides the water and counts what is in sight, and on a pasture too big to cover in a day, what is in sight is only part of the herd. Cattle bunch up in the draws and the brush on a hot day. The count that goes in the record is an estimate, and everyone in the crew knows it.
The grass gets the same treatment. You look at it from the road, you kick at it at the water tank, you remember what the pasture looked like last year. The trouble shows up late. One pasture is carrying more than the grazing plan assumed, another sits half empty, and you find out when the forage is already short and the move you should have made two weeks ago has to happen this week.
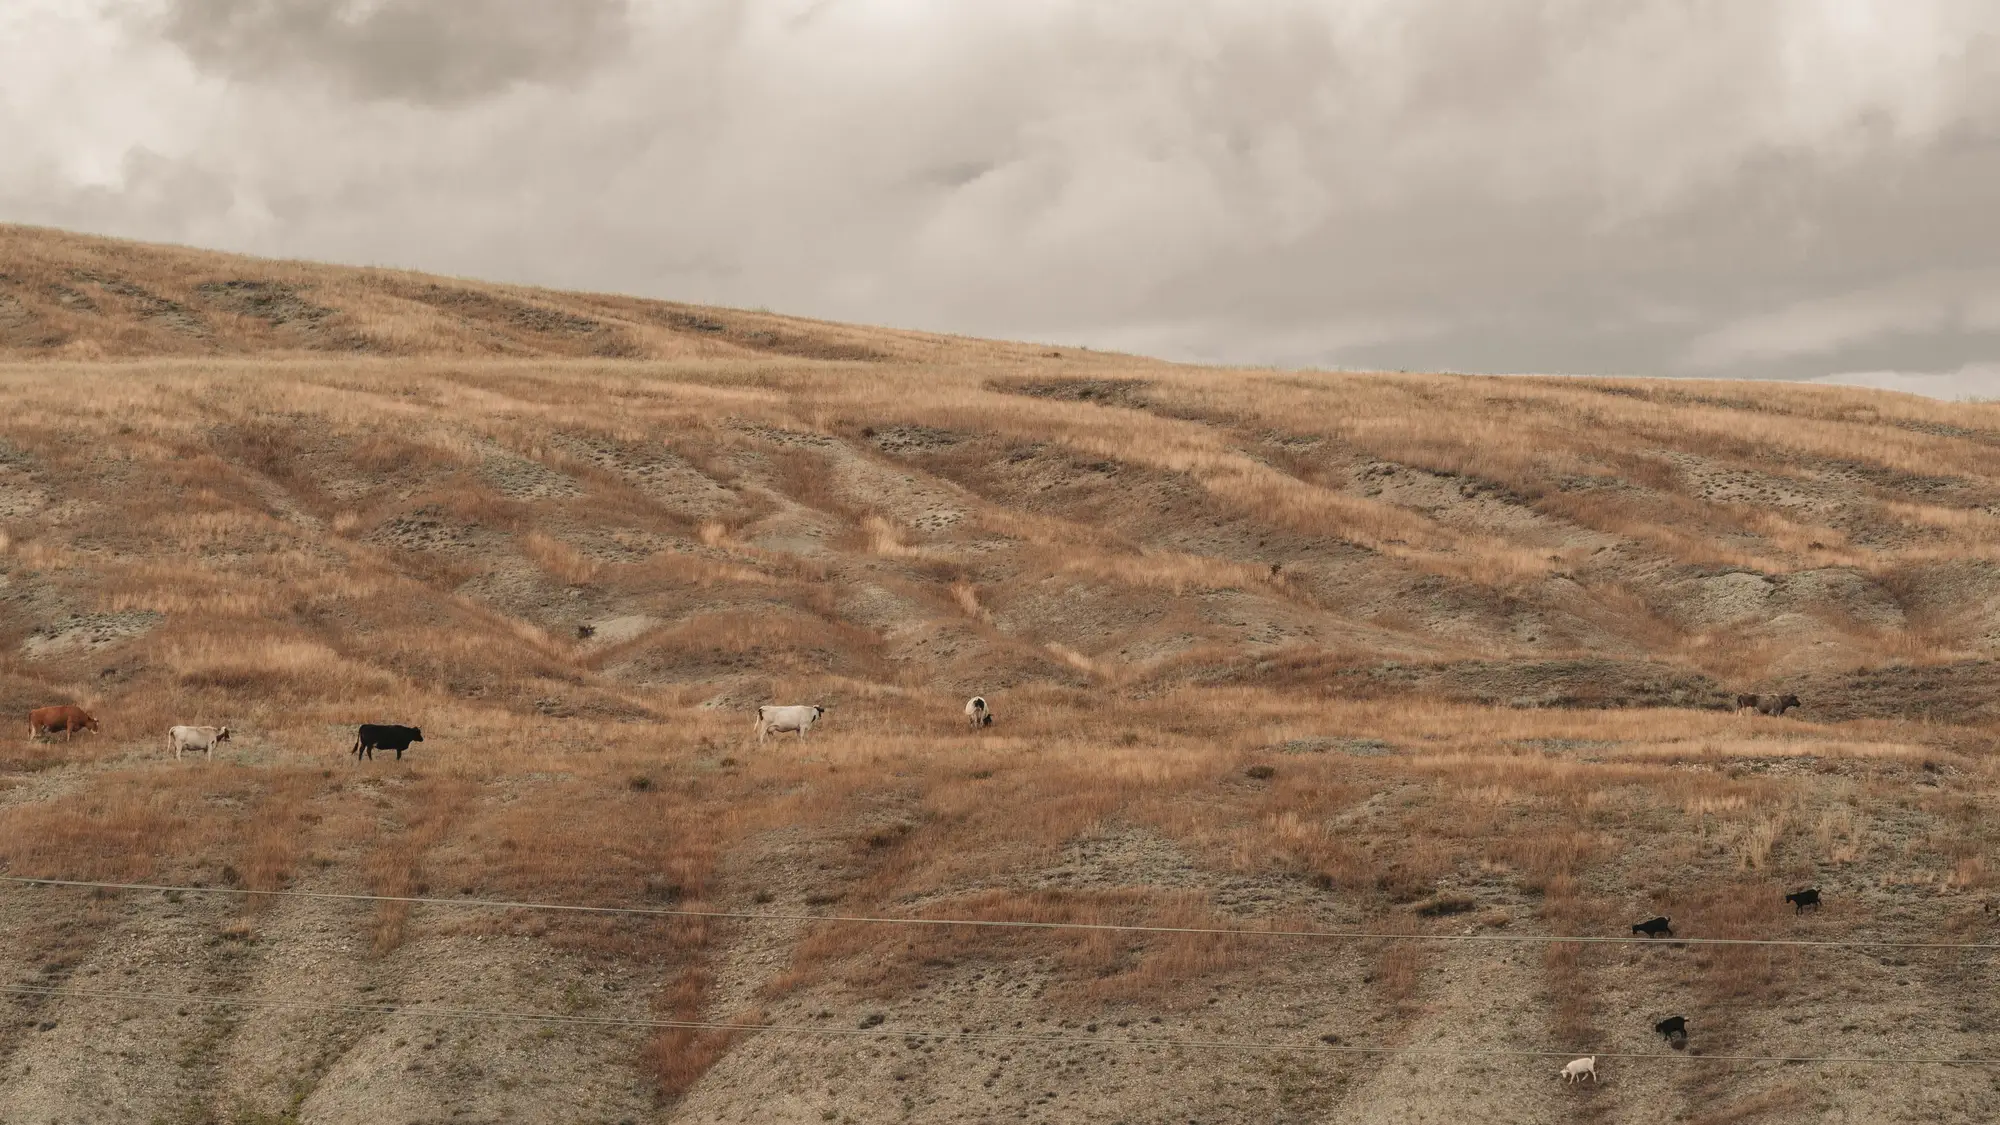
The full count comes at the gather, and by then the season is mostly spent. A lender asking for a herd inventory gets the same book number you have.
Livestock Counting adds a between-gathers read for each pasture, monthly, so the move off an overgrazed pasture is a decision you make early.1
What comes back each month
- 2.1
Head count per pasture
CSV
One row per pasture: the pasture name, the count of animals detected in the month's pass, and the date of the imagery. It lands in the same spreadsheet where you keep head by pasture, next to the number you expect.23
- 2.2
Biomass trend per pasture
CSV and GIS layer
A monthly read of standing forage for each pasture, kept as a running series so you can see whether a pasture is holding, drawing down or recovering. Open it in QGIS or whatever GIS the ranch already uses.4
- 2.3
Stocking-rate flag
over, under, within range
Each pasture is marked over-stocked, under-stocked or within range, from the count and the biomass read against the stocking rate on your grazing plan. The flag says where to look first. You make the call on the move.
- 2.4
Pasture map
GeoPackage or shapefile
Your own pasture boundaries carrying the count, the biomass class and the flag, so you can put the month on the map beside the grazing plan.
How it works
Pastures in
You send the pasture boundaries as a shapefile or KML, with the stocking rate or head you planned for each one. If you have no boundary file, tell us and we agree how to draw them with you.
Monthly pass
We pull the clearest very-high-resolution satellite or aerial pass over your pastures for the month, at 0.3 m or finer.5
Detection and biomass read
Animals are detected and counted inside each boundary. Standing forage is read from the same pass and compared with earlier months.6
Count and flag delivered
The head count, biomass trend, flag and pasture map come back. On a pilot, we go through the first delivery with you and compare the counts with what you know is in the pastures.
Where it fits in your workflow
Between gathers
Use the flag to choose which pasture to ride first, which herd to move and when to start the destocking conversation in a dry year. The gather stays the count of record. Where a lender wants a herd inventory or a collateral check between inspections, the monthly count gives the loan officer a picture that is not just your book number, which is a separate use from the pasture move and is worth raising with them.
Limits
- 1Not the count of record
- This is a between-gathers check. It does not replace the gather, a brand inspection or any legal or certified head count.
- 2Resolution floor
- At 0.3 m a cow is a handful of pixels across. Single animals in open ground are countable. Animals standing shoulder to shoulder or lying in a tight group can merge into one shape, so a bunched herd tends to be counted low.
- 3Animals only, not their condition
- It counts and flags stocking rate. It says nothing about breed, health, body condition or class of animal, and it does not tell a cow from a steer or a calf.
- 4Monthly, as a target
- One pass a month is the plan. It is a target, not a promise for every pasture every month, and the first months build the biomass trend rather than show one.
- 5Clear-sky window
- Optical imagery needs a clear day. A cloudy month can push the pass late or skip it, and snow-covered ground makes animals and forage harder to read.
- 6Tree and brush cover
- Animals under canopy, in heavy brush or in deep shade are hidden from an optical pass. Open range with clear sightlines works best, and a pasture that is mostly timber will come back with a low-confidence flag.
Who it's for
For
- Ranch managers running open-range or big-pasture cattle who cannot see every head between gathers
- Operators who move pastures on the grazing plan and want the flag before the forage is short
- Owners and agricultural lenders who want a monthly picture of stocking beside the herd inventory
Not for
- Buyers who need a certified or legal head count, or a brand or health inspection
- Small, fenced pastures where you can see every head from the gate
- Operations wanting animal health, body condition or breed identification
- Herds running under heavy timber, where an optical pass will miss animals
Questions before a pilot
Can this replace a gather count?
No. It is a check between gathers. The gather stays your count of record, and the monthly numbers tell you which pasture to worry about before then.
Does it work in brush or under trees?
Open range with clear sightlines works best. Animals under heavy canopy or in dense brush can be missed, and pastures like that come back flagged low-confidence.
What resolution does it need?
Imagery at 0.3 m or finer. Coarser pixels cannot resolve single animals, so this is not offered on medium or wide imagery.
Does it assess animal health?
No. It counts animals and flags stocking rate. It does not judge condition, breed, class or health.
How do I check it against my own numbers?
Pick pastures where you know the head count, ideally a gather that falls near a monthly pass, and compare. Decide from that whether the count is good enough to plan with. We do not quote an accuracy figure.
How does the file get into my records?
A CSV with one row per pasture, plus a GeoPackage or shapefile of your boundaries. Anything that reads a spreadsheet or a GIS layer can open them. We do not write into your herd-record software.
Who owns the results and the imagery?
Ownership and licence terms for the deliverables and the imagery are written into the pilot agreement before anything is ordered. If your lender or attorney wants to read them, ask early.
How is a pilot bought and priced?
The quote depends on the number and size of pastures and the imagery source, so we price it for the pastures you pick. Tell us how you usually buy services and we will scope the pilot to fit.
Start a monthly count on your range.
Tell us which pastures you would put in the pilot and when your next pasture move or gather falls. We will say plainly whether the imagery calendar can meet it.
Start a pilot